After crushing its revenue and earnings expectations on November 2nd, Expedia (EXPE) has been on a roll. Here are the quarterly numbers that the internet travel giant posted a little over two weeks ago:
Revenues: $3.93 billion (actual) vs. $3.87 billion (estimate)EPS: $5.41 (actual) vs. $5.15 (estimate)
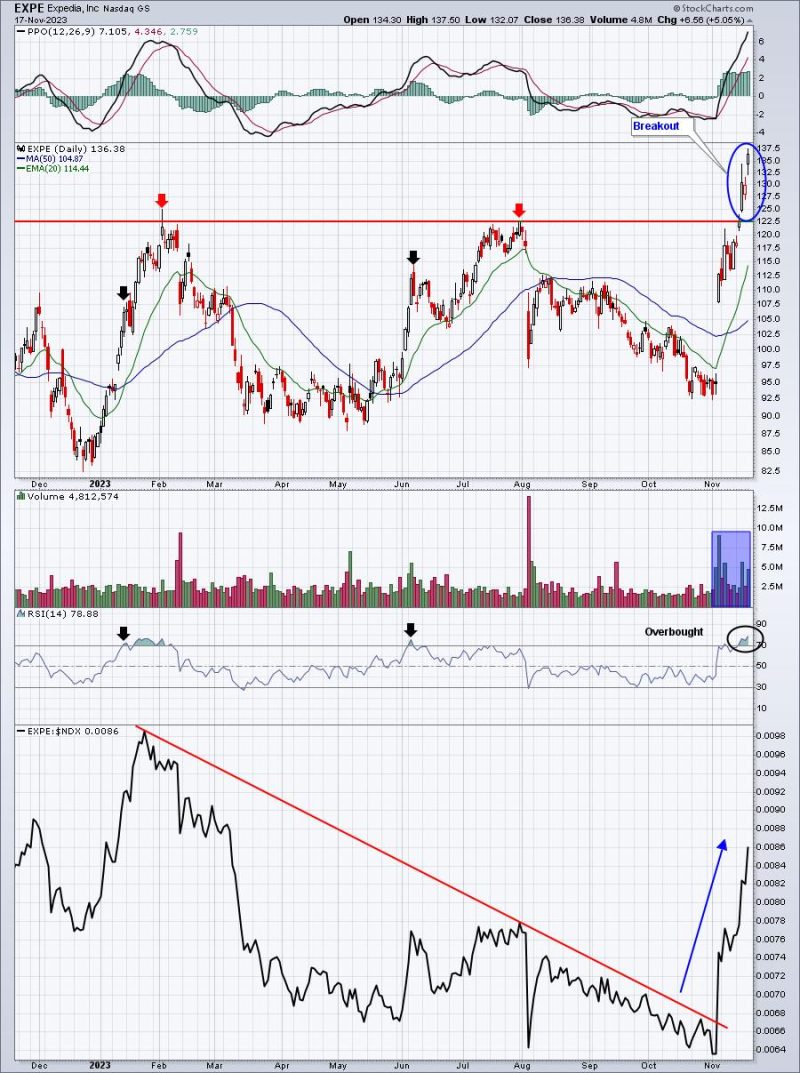
The move in EXPE has been so strong that it ranks as THE top performing stock in the S&P 500 over the past month, gaining more than 34%. While it’s likely to pull back from overbought conditions at any time, the bigger picture breakout above key price resistance near 122-123 is significant:
The prior two overbought situations, EXPE continued rising in January, but clearly fell back in June, before extending its rally through July.
Investing is all about choices, however. While EXPE looks much better now than it has at any time over the past year, I still have to question its relative strength vs. a primary competitor like Booking Holdings (BKNG). This charts gives us a little different angle:
BKNG was the clear choice in the early years of competition as EXPE consistently underperformed on a relative basis. That’s changed over the past dozen years, however, as strength seems to move back and forth. After a rather significant long-term relative breakdown on EXPE, it’s stormed back. It would seem that EXPE’s current relative strength may last for awhile, based on the history of these two – at least that’s the way I’d view it until current relative strength reverses.
Before placing any trades, I nearly always review historical patterns on the benchmark S&P 500 as it can provide us very important clues as to overall market direction. If you’d like to receive this data for FREE to help improve your trading/investing success, simply CLICK HERE and download my 7-page PDF. One interesting fact is that the same 10-consecutive day period of EVERY calendar month has produced over 80% of the gains on the S&P 500 since 1950. So essentially 30% of the month produces more than 80% of the gains. It might be worthwhile in your trading to know which days produce these gains!
Happy trading!
Tom


