There are a number of ways that you can find great trading opportunities. One way is to simply follow a chart on a WatchList and wait for certain indicators to reach “buy” points. For instance, an uptrending stock many times will find support as its 20-day EMA is tested or when its RSI approaches 40 during pullbacks. For this article, however, I want to show you an interesting way to use RRG charts to accomplish the same thing, only RRG charts might be better for traders who visualize movements better when comparing relative moves.
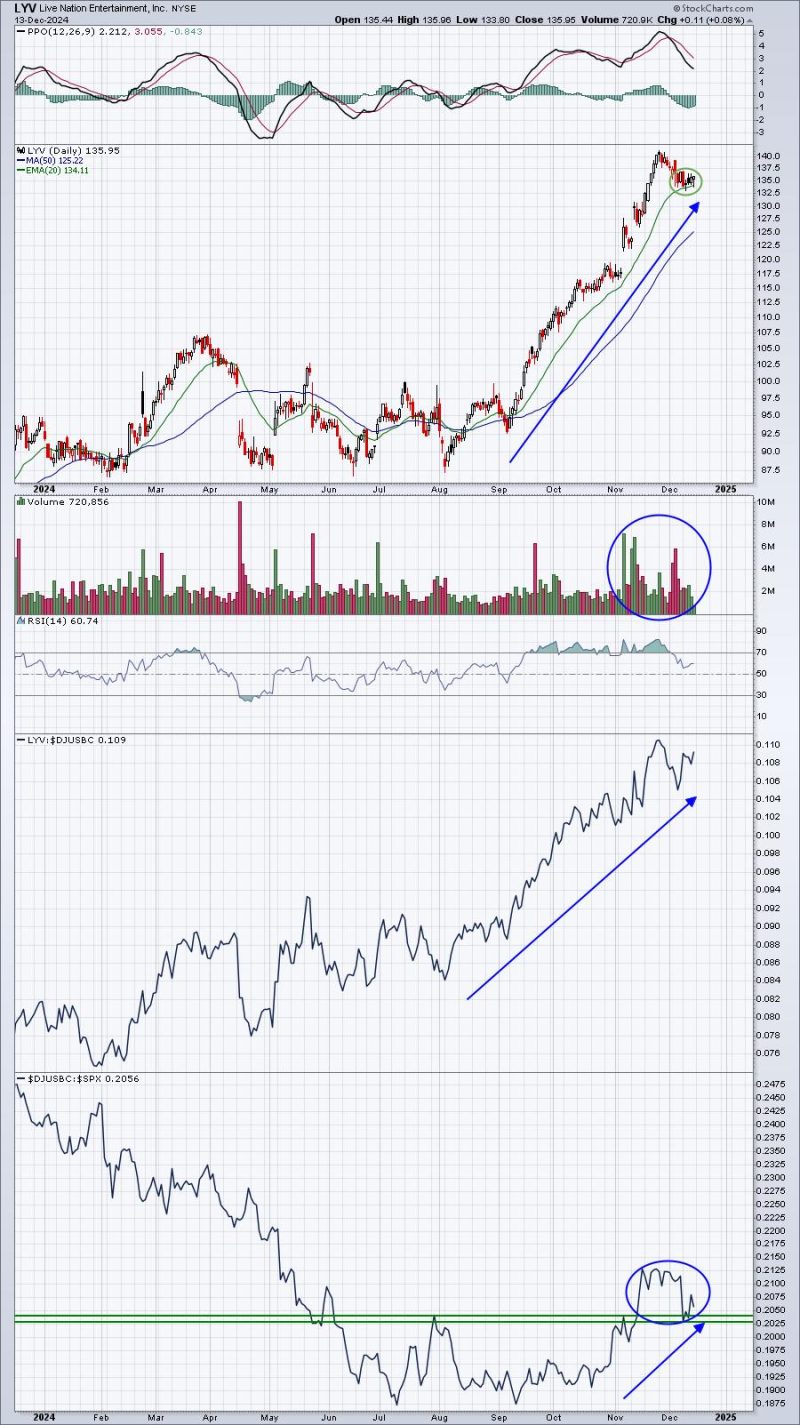
Live Nation (LYV) is in the communication services (XLC) sector and from early-August through late-November, it was in a stealth uptrend outpacing nearly all stocks on a relative basis as it gained over 60% in that 3 1/2 month span. I like to see 20-day EMA tests and this one is quite clear:
There’s a lot to like here as LYV’s industry group – broadcasting & entertainment ($DJUSBC) – is now showing much better relative strength to the S&P 500. In other words, money is rotating INTO the entertainment area and, as an industry group leader, LYV is reaping the rewards. The early-December selloff has taken LYV out of overbought territory on its RSI and allowed it to test its rising 20-day EMA, setting up for a bounce.
If I use the weekly and daily RRG charts and dissect the component stocks within the communication services sector, here’s what I find:
Weekly RRG – XLC
I’ve highlighted LYV as it’s the furthest XLC component stock to the right and in the leading quadrant, showing both strong bullish momentum and excellent relative strength. That tells us that we have a stock worth watching for possible trade setups during periods of short-term selling. For that short-term selling and how it looks on a daily RRG, let’s drill down to that time frame and check it out.
Daily RRG – XLC
Once again, I’ve highlighted LYV so that you can visualize its movement from an RRG perspective. From experience, many leading stocks will have short-term pullbacks where they move all the way through the Weakening quadrant, only to turn higher and head back towards the Leading quadrant. LYV’s sharp chart would show this as a rally back to test the recent price high. If and when that occurs, we’ll see LYV’s daily RRG chart turn back towards the Leading quadrant. But my point here isn’t whether LYV moves higher again for us to make money. Instead, I’m simply pointing out how healthy stocks will look on their weekly and daily RRGs. The weekly chart will highlight a stock’s powerful recent move higher and the daily chart will help us to identify those bullish stocks, and possible entry points, that are experiencing short-term weakness.
As a swing trader, this is EXACTLY what we want to look for.
Huge RRG Event
Saturday morning at 10:00am ET, Julius de Kempenaer, Sr. Technical Analyst here at StockCharts.com and the founder and creator of RRG charts, will join me for a FREE (no credit card required) EarningsBeats.com event, “Key Rotation Into 2025”, where we’ll use RRG charts to show everyone the critical rotation that’s taking place now that will likely help shape the direction of our major indices during the balance of 2024 and throughout 2025. For more information and to register for the event, CLICK HERE.
If you cannot make the event live, those registering will receive a copy of the recording of the event that you can check out at your earliest convenience. So please register NOW and save your seat!
Happy trading!
Tom


