


So the first Fed rate cut is behind us, and we are no longer in a “higher for longer” period, but in a new rate cut cycle which will most likely last well into 2025. So that’s good news for stocks, right? Well, not necessarily.
The reality is that rate cut cycles do not happen very often. On average, there’s one rate cut cycle about every ten years. This is because the Fed raises and lowers rates in line with the economic cycle. When the economy is growing, they can raise rates to keep growth in check. And when the economy starts to slow down, they can lower rates to encourage spending and economic growth.
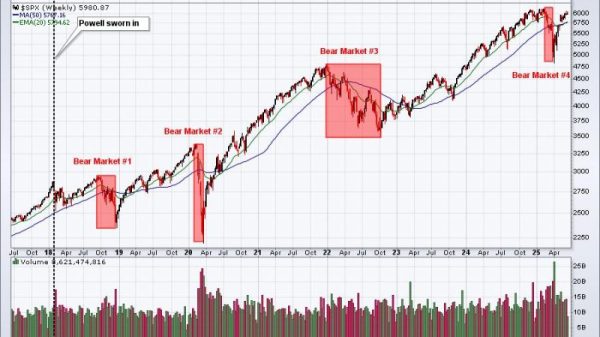
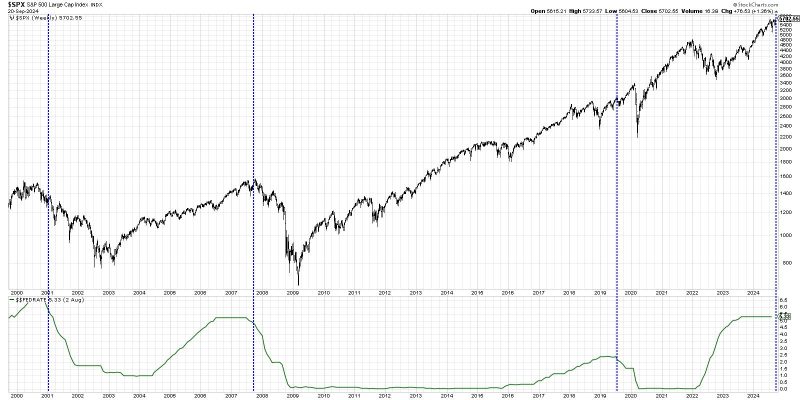
The chart above shows the S&P 500 index along with the Effective Fed Funds Rate. I’ve added blue vertical lines to identify when the Fed made their first rate cut in each cycle. So why are seasoned investment professionals a little hesitant to break out the champagne after the first rate cut this week? Because they remember years like 2001 and 2007, when the stock market pushed lower for months and months after that first decision.
Now, to be fair, the S&P did move higher for about 6-7 months after the first rate cut in 2019. The COVID-19 pandemic changed the game in many ways, so it’s impossible to gauge whether the markets would have gone higher without that market-changing event. But, generally speaking, stocks have often moved lower after the first rate cut decision.
To paint a more complete picture of the relationship between interest rates and stock market performance, let’s also look at the shape of the yield curve. Our next chart shows the spread between the Ten-Year Treasury Yield and the Two-Year Treasury Yield, commonly known as “2s vs. 10s” in the industry.
The top panel shows the different between the 10-year yield and the 2-year yield. I’ve added a purple horizontal line right at the zero level, because when the ratio dips below this point, we have what’s known as an inverted yield curve. I’ve also added red vertical lines to show when the yield curve had been inverted, but had switched to a more normalized shape. The orange-shaded areas denote recessionary periods, and the bottom panel shows the S&P 500 for reference.
Note how pretty much every recession has seen a similar chain of events. First, the yield curve becomes inverted as fixed income investors become less optimistic about future economic growth. Eventually, the yield curve returns to a normal shape, and soon after, the stock market begins to drop as the economy dips into a recession.
Now, does all of this mean we are guaranteed to see lower stock prices as we’ve seen when similar patterns emerge? Of course not. Remember, interest rates and the Fed are just part of a rich, dynamic, complex system of indicators to help us understand the market environment.
But if history provides any lesson here, it’s that a rate cut cycle has usually been very good for stocks, but not immediately. Mindful investors should remain vigilant, watching for signs of a potential downtrend, and focusing on areas of the market still showing relative strength in light of market uncertainties.
RR#6,
Dave
P.S. Ready to upgrade your investment process? Check out my free behavioral investing course!
David Keller, CMT
Chief Market Strategist
StockCharts.com
Disclaimer: This blog is for educational purposes only and should not be construed as financial advice. The ideas and strategies should never be used without first assessing your own personal and financial situation, or without consulting a financial professional.
The author does not have a position in mentioned securities at the time of publication. Any opinions expressed herein are solely those of the author and do not in any way represent the views or opinions of any other person or entity.