DecisionPoint tracks 26 market, sector, and industry group indexes, and we monitor moving average crossovers for those indexes to assess the bullish or bearish condition of those indexes. A Silver Cross BUY Signal is generated when the 20-day exponential moving average (EMA) of a price index crosses up through the 50-day EMA. This gives a strong indication that the price index is in a bullish configuration.
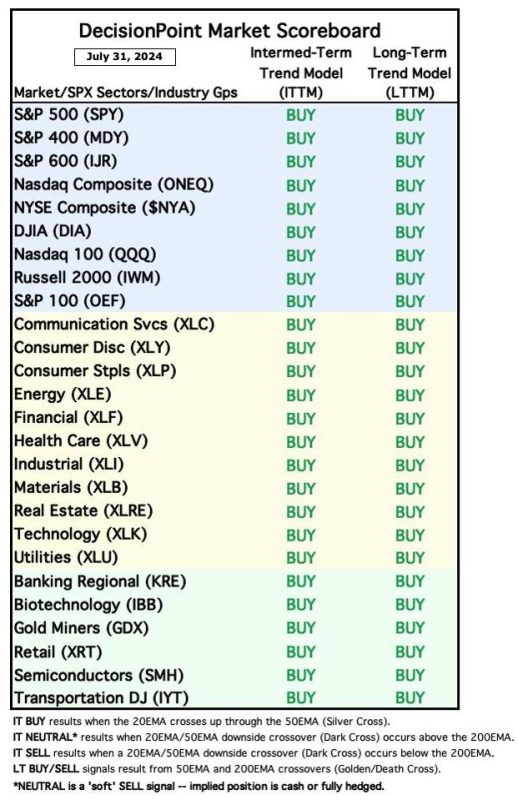
The left column of the following table shows the IT signal status of the indexes we track. The right column is for the longer-term Golden Cross signals (50/200-day EMA crossovers), which are not an issue now. This is how the table looked on July 31, 2024:
The next table shows the signal status as of today, and we can see that there is considerable deterioration in the market status. Nine of the indexes have changed from a BUY Signal to NEUTRAL, which is when the 20-day EMA crosses down through the 50-day EMA (Dark Cross) above the 200-day EMA. (It would be a SELL Signal if the 20/50 EMA downside crossover took place below the 200-day EMA.) Of the remaining IT BUY Signals, all but three are liable to switch to NEUTRAL within the next few weeks. The three that look safe (for now) are Consumer Discretionary, Real Estate, and Utilities.
Concluding Thoughts
The stock market is experiencing broad-based intermediate-term deterioration. Nine indexes have lost BUY Signals, and most of the rest are likely to lose their BUY Signals in a week or so unless the current rally continues and broadens out.
Learn more about DecisionPoint.com.
Watch the latest episode of the DecisionPointTrading Room on DP’s YouTube channel here!
Try us out for two weeks with a trial subscription!
Use coupon code: DPTRIAL2 at checkout!
Technical Analysis is a windsock, not a crystal ball. –Carl Swenlin
(c) Copyright 2024 DecisionPoint.com
Disclaimer: This blog is for educational purposes only and should not be construed as financial advice. The ideas and strategies should never be used without first assessing your own personal and financial situation, or without consulting a financial professional. Any opinions expressed herein are solely those of the author, and do not in any way represent the views or opinions of any other person or entity.
DecisionPoint is not a registered investment advisor. Investment and trading decisions are solely your responsibility. DecisionPoint newsletters, blogs or website materials should NOT be interpreted as a recommendation or solicitation to buy or sell any security or to take any specific action.
Helpful DecisionPoint Links:
Price Momentum Oscillator (PMO)


