We’ve all heard that popular Wall Street adage, “Go away in May”, right? It’s cute and it rhymes, so why wouldn’t we make the HUGE decision to liquidate all of our stock holdings? <sarcasm> Did I mention it rhymes? One of the biggest disservices to investors everywhere is the “all in” approach the media takes with regard to “go away in May.”
Investing is not that simple and a dose of independent research would help a lot of analysts.
Let me first start by saying that there is some truth to this adage. The premise behind “go away in May” is that the May through October period is weaker than the November through April period. This is true and here are the annualized returns since 1950 on the S&P 500 to support it:
November through April: +14.59%
May through October: +3.74%
The numbers don’t lie. But the question isn’t which period is better. The question is whether you should “go away in May”. I don’t think taking this adage literally makes very much sense and I’ll explain why.
Secular Bull Market Makes a Difference
I believe every May needs to be analyzed separately based on the market’s current technical and sentiment conditions. Yes, the tendency is to be weaker from May through October, and we shouldn’t lose sight of that fact, but we’re in a 11-year secular bull market. Returns in a secular bull market are much better than the “average” year. Let me break down the returns of the two periods in question during this secular bull market:
November through April: +17.04%
May through October: +10.57%
The November through April period has been stronger for sure, but do you really want to “go away” during the May through October period. 10.57% is a very nice annualized return. What I have written about in the past is that the true “go away” period historically has been from the close on July 17th through the close on September 26th. Even during this secular bull market of the past 11 years, this July 18th through September 26th has posted an annualized return of -3.72%. This is your true “go away” period. Unfortunately, it doesn’t rhyme and many CNBC contributors don’t do necessary research – they just follow along with the jingle.
Finally, going back to 1950, the May through October period annualized return jumps from 3.74% to 7.59% if we simply exclude that true “go away” period from July 18th through September 26th.
Growth vs. Value
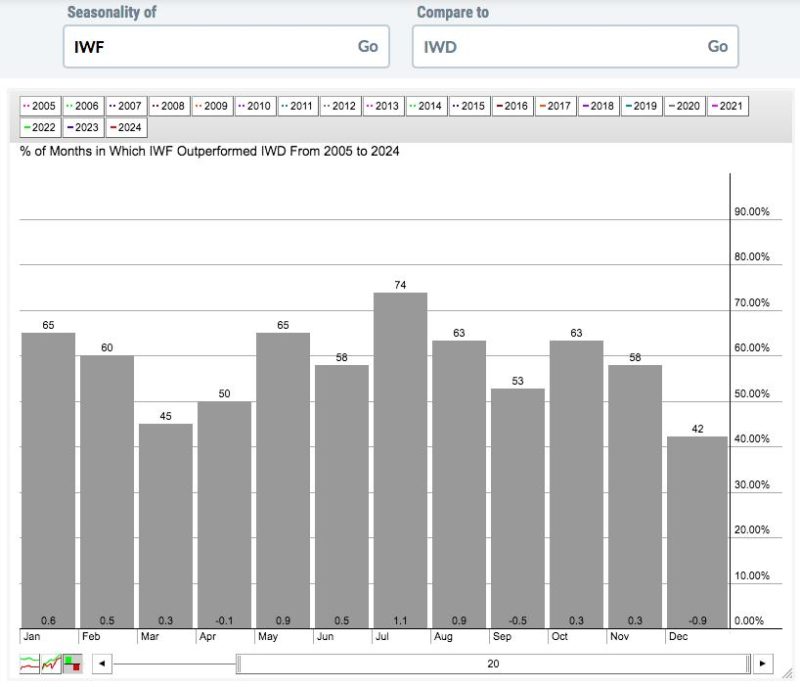
While May through October is weaker, did you know that the best 4-consecutive month period for growth stocks (IWF) vs. value stocks (IWD) in May through August? Check out this seasonality chart for the IWF:IWD over the past 20 years (which includes both bull and bear markets):
If we add up that monthly outperformance/underperformance, you’ll see that May through August shows the IWF outperforming the IWD by 3.4%, while outperforming by just 0.5% during the other 8 months. You miss all of that growth outperformance by sitting out from May through October.
How about Apple’s (AAPL) historical performance. This is one of the largest market cap companies in the world and a big driver of the S&P 500. Let’s see how AAPL performs relative to the S&P 500 on a monthly basis over the past 20 years:
Here’s AAPL’s outperformance:
May through October: +17.8%
November through April: +5.6%
You don’t want to “go away” from AAPL during that May through October period, do you?
Weekly Market Recap Video
After taking last weekend off for a vacation, I returned to YouTube yesterday for my latest weekly recap. I explained why this looks NOTHING like a bear market. Feel free to check out my “This Is NOT A Bear Market” video at your leisure. Please be sure to “Like” the video and “Subscribe” to our YouTube channel. I’d certainly appreciate your support!
DON’T Go Away in May Event
If you find research like the above to play an important role in your stock market analysis and decisions, then you’ll love our next event on Tuesday, May 7, at 4:30pm ET! There are a few warning signs in the stock market right now and I’ll discuss each of them in detail and provide you exactly what to look for to confirm that the next leg of the current secular bull market is underway. This is a “Can’t Miss” event reserved for our members at EarningsBeats.com, but a FREE 30-day trial is all you’ll need to get the best up-t0-date independent research available. For more information on this timely event and to register, CLICK HERE.
Happy trading!
Tom


